GOES-17 Satellite Launch Puts Latest Weather Tech Into Orbit

The latest in the GOES series of weather satellites, GOES-S, was launched from Cape Canaveral, Florida on Thursday. It joins GOES-16 in geostationary orbit, launched in late 2016. GOES-S will be redesignated GOES-17 when it becomes operational later this year. It will serve as NOAA’s GOES West satellite, responsible for covering the U.S. west coast, Hawaii, Alaska, and much of the Pacific Ocean.

The new GOES satellites will be able to collect three times the amount of meteorological data as their predecessors. They’ll also collect the data at four times the spatial resolution, five times as fast! GOES 17 in particular will have critical responsibilities that include monitoring winter storm systems approaching the U.S. and Pacific basin hurricanes. Thermal infrared imagery will help meteorologists spot fires faster (see above – image courtesy CIRA).

One of the most exciting new technologies on board the new GOES satellites is the Geostationary Lightning Mapper (GLM). Unlike ground sensor-based lightning detection networks, the GLM will be able to monitor lightning strikes over the ocean. These data could help radically improve forecasts of hurricane strength, for instance. However, it will not be able to distinguish between cloud-to-ground and cloud-to-cloud lightning strikes on its own.

Slow-Moving Storm Producing Torrential Rains across Northern Queensland!

An upper low drifting slowly across northern Queensland has a history of producing major flooding. As of Saturday morning, it’s still producing heavy rains over western parts of the state. These are less densely populated but more arid areas sensitive to these record rains. Here’s a select list of rainfall totals over the last several days:


Queensland Rainfall Totals (since 28-February):

Bluewater: 516 mm

Mt. Margaret: 509 mm

Stony Creek: 441 mm

Deeragun: 420 mm

Pallarenda: 342 mm

Townsville: 263 mm


A tap of rich tropical moisture from the Gulf of Carpentaria is to blame for the prolonged heavy rain threat. The upper low is expected to drift slowly and erratically over western Queensland and perhaps eastern Northern Territory, dropping additional heavy rains over the inland deserts through the next several days (see above). It could also help fuel a severe storm threat further southeast later this weekend. Check morecast.com and the Morecast app for the latest forecast details for your location!


Nor’Easter Storm Wreaking Havoc From Mid-Atlantic to New England!

A powerful late-season winter storm spun up quickly off the U.S. Eastern Seaboard late Thursday into Friday, leading to heavy snows over the interior, flooding for the coast, and damaging winds throughout the region. The storm is still pounding portions of the Northeast as of Friday evening but here are a few of the impacts so far:


Highest Wind Gusts:

Washington, DC (Dulles): 67 mph (108 kph)

New York, NY (JFK): 63 mph (101 kph)

Providence, RI: 64 mph (103 kph)

Boston, MA: 60 mph (97 kph)


Millions have been reported without power thanks to fallen trees and power lines. Major bridges such as the Verrazano-Narrows Bridge in New York City have been forced to close. These strong east to northeast winds are also pushing sea water onshore, leading to major surge flooding, especially along the coast of Massachusetts. Very heavy rainfall of up to three inches is contributing to high water issues.

The major cities are just warm enough to be spared snow and ice accumulation. However, interior sections, especially the mountains, are seeing a crippling combination of winds and heavy, wet snow. Storm totals will likely exceed three feet in some areas with prolonged blizzard conditions. In the words of the National Weather Service, this is going to be “one to remember!” Rely on morecast.com and the Morecast app for the latest forecast details for your location!


Superstorm Sandy: A $70 Billion Storm

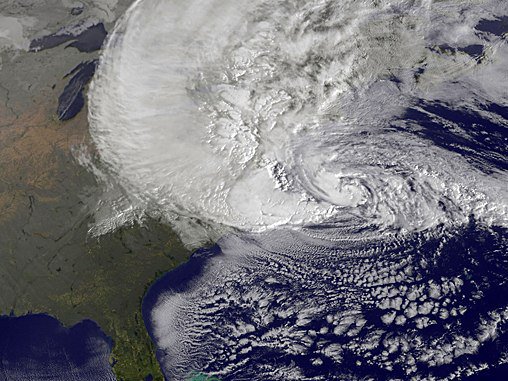
October 29th, 2017 will mark the 5th anniversary of Superstorm Sandy making landfall in southern New Jersey. Sandy had wide reaching impacts to the eastern half of the U.S. 24 states were directly affected in some way.

All totaled, Sandy’s cost to the U.S. is approximately $70 billion. This ranks as the second costliest weather & climate disaster on record. A closer look at the mainland U.S. impacts from Sandy are below.

Storm Surge

The hardest hit areas from Sandy included the New Jersey and New York coastlines. This is largely due to the immense storm surge that piled up against the coast when the Superstorm took its left-handed turn into New Jersey.

The highest recorded storm surge of 12.65 feet occurred at Kings Point, NY which is on the north shore of the Long Island Sound. Further, a storm surge of almost 3 feet or greater was observed in every East Coast state from Florida to Maine.

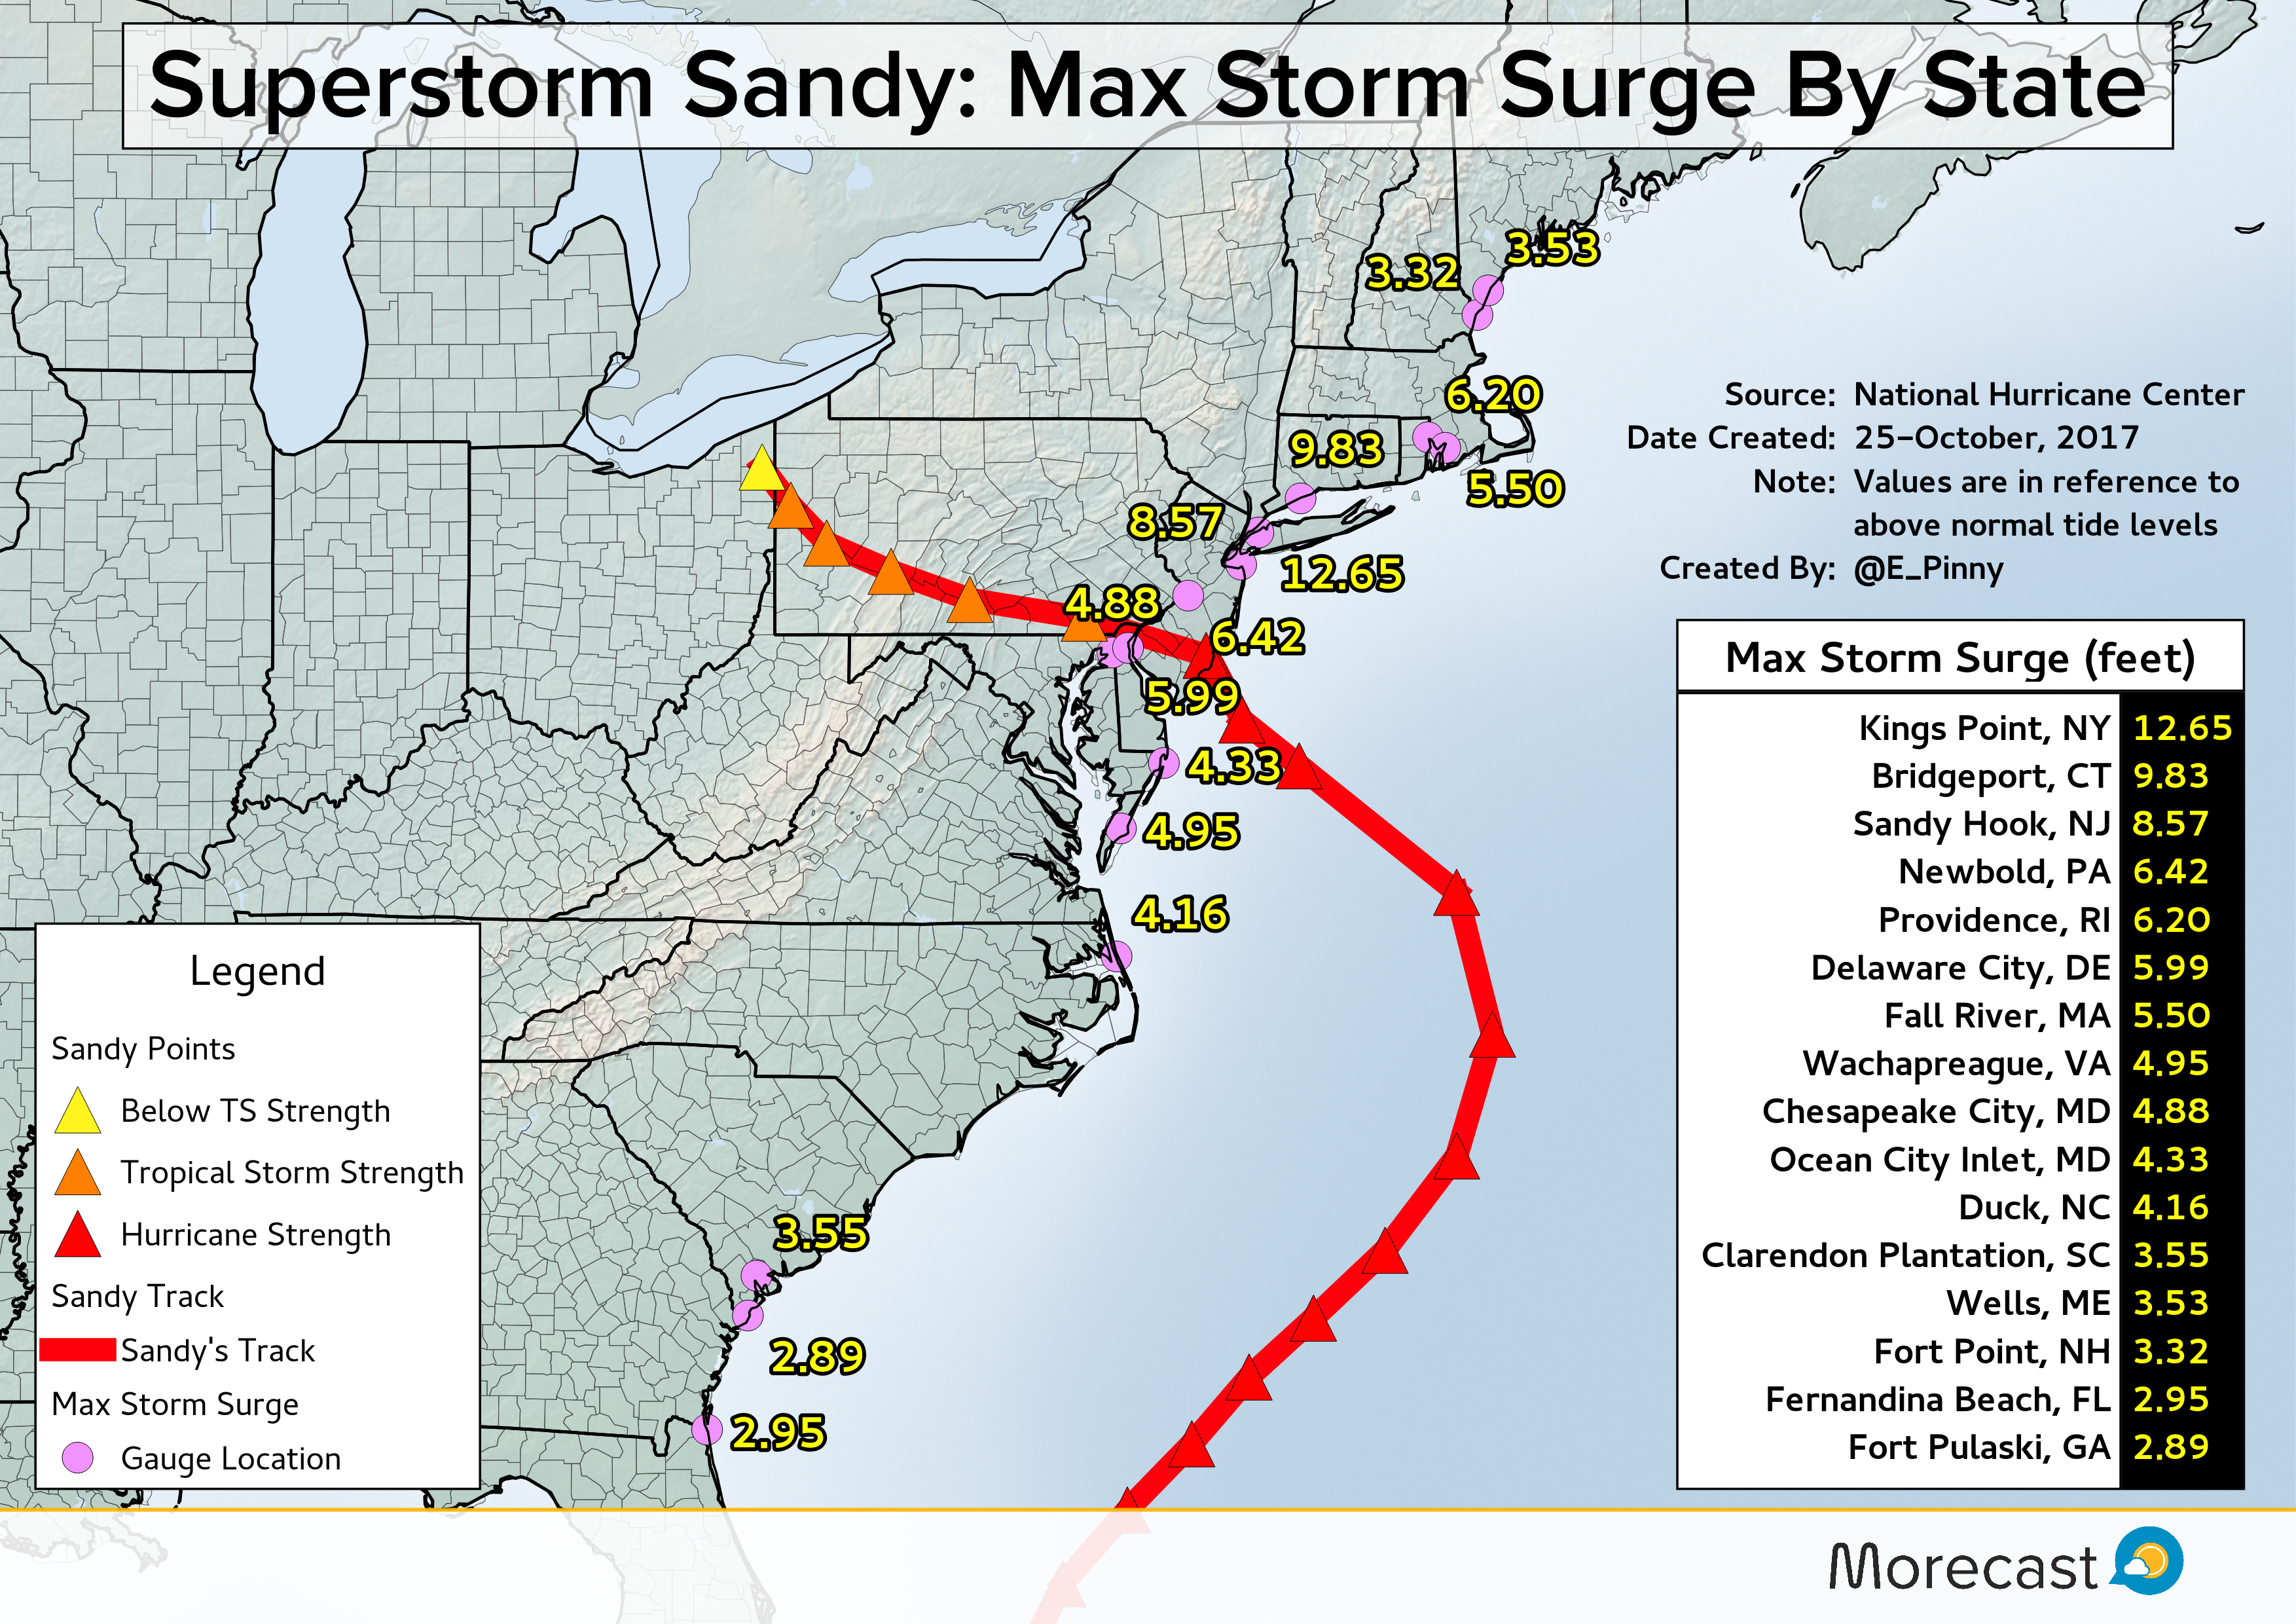
As is typical in many strong tropical cyclones, the storm surge is the biggest contributor to the cost of a storm.

According to the National Hurricane Center’s recap of Sandy, the Metropolitan Transit Authority in NYC reported that 8 subway tunnels were flooded as a result of storm surge. The estimated cost to repair damages to the tunnels is $5 billion. Furthermore, NYC estimates that Sandy will cost the entire city $19 billion mostly because of storm surge damage.
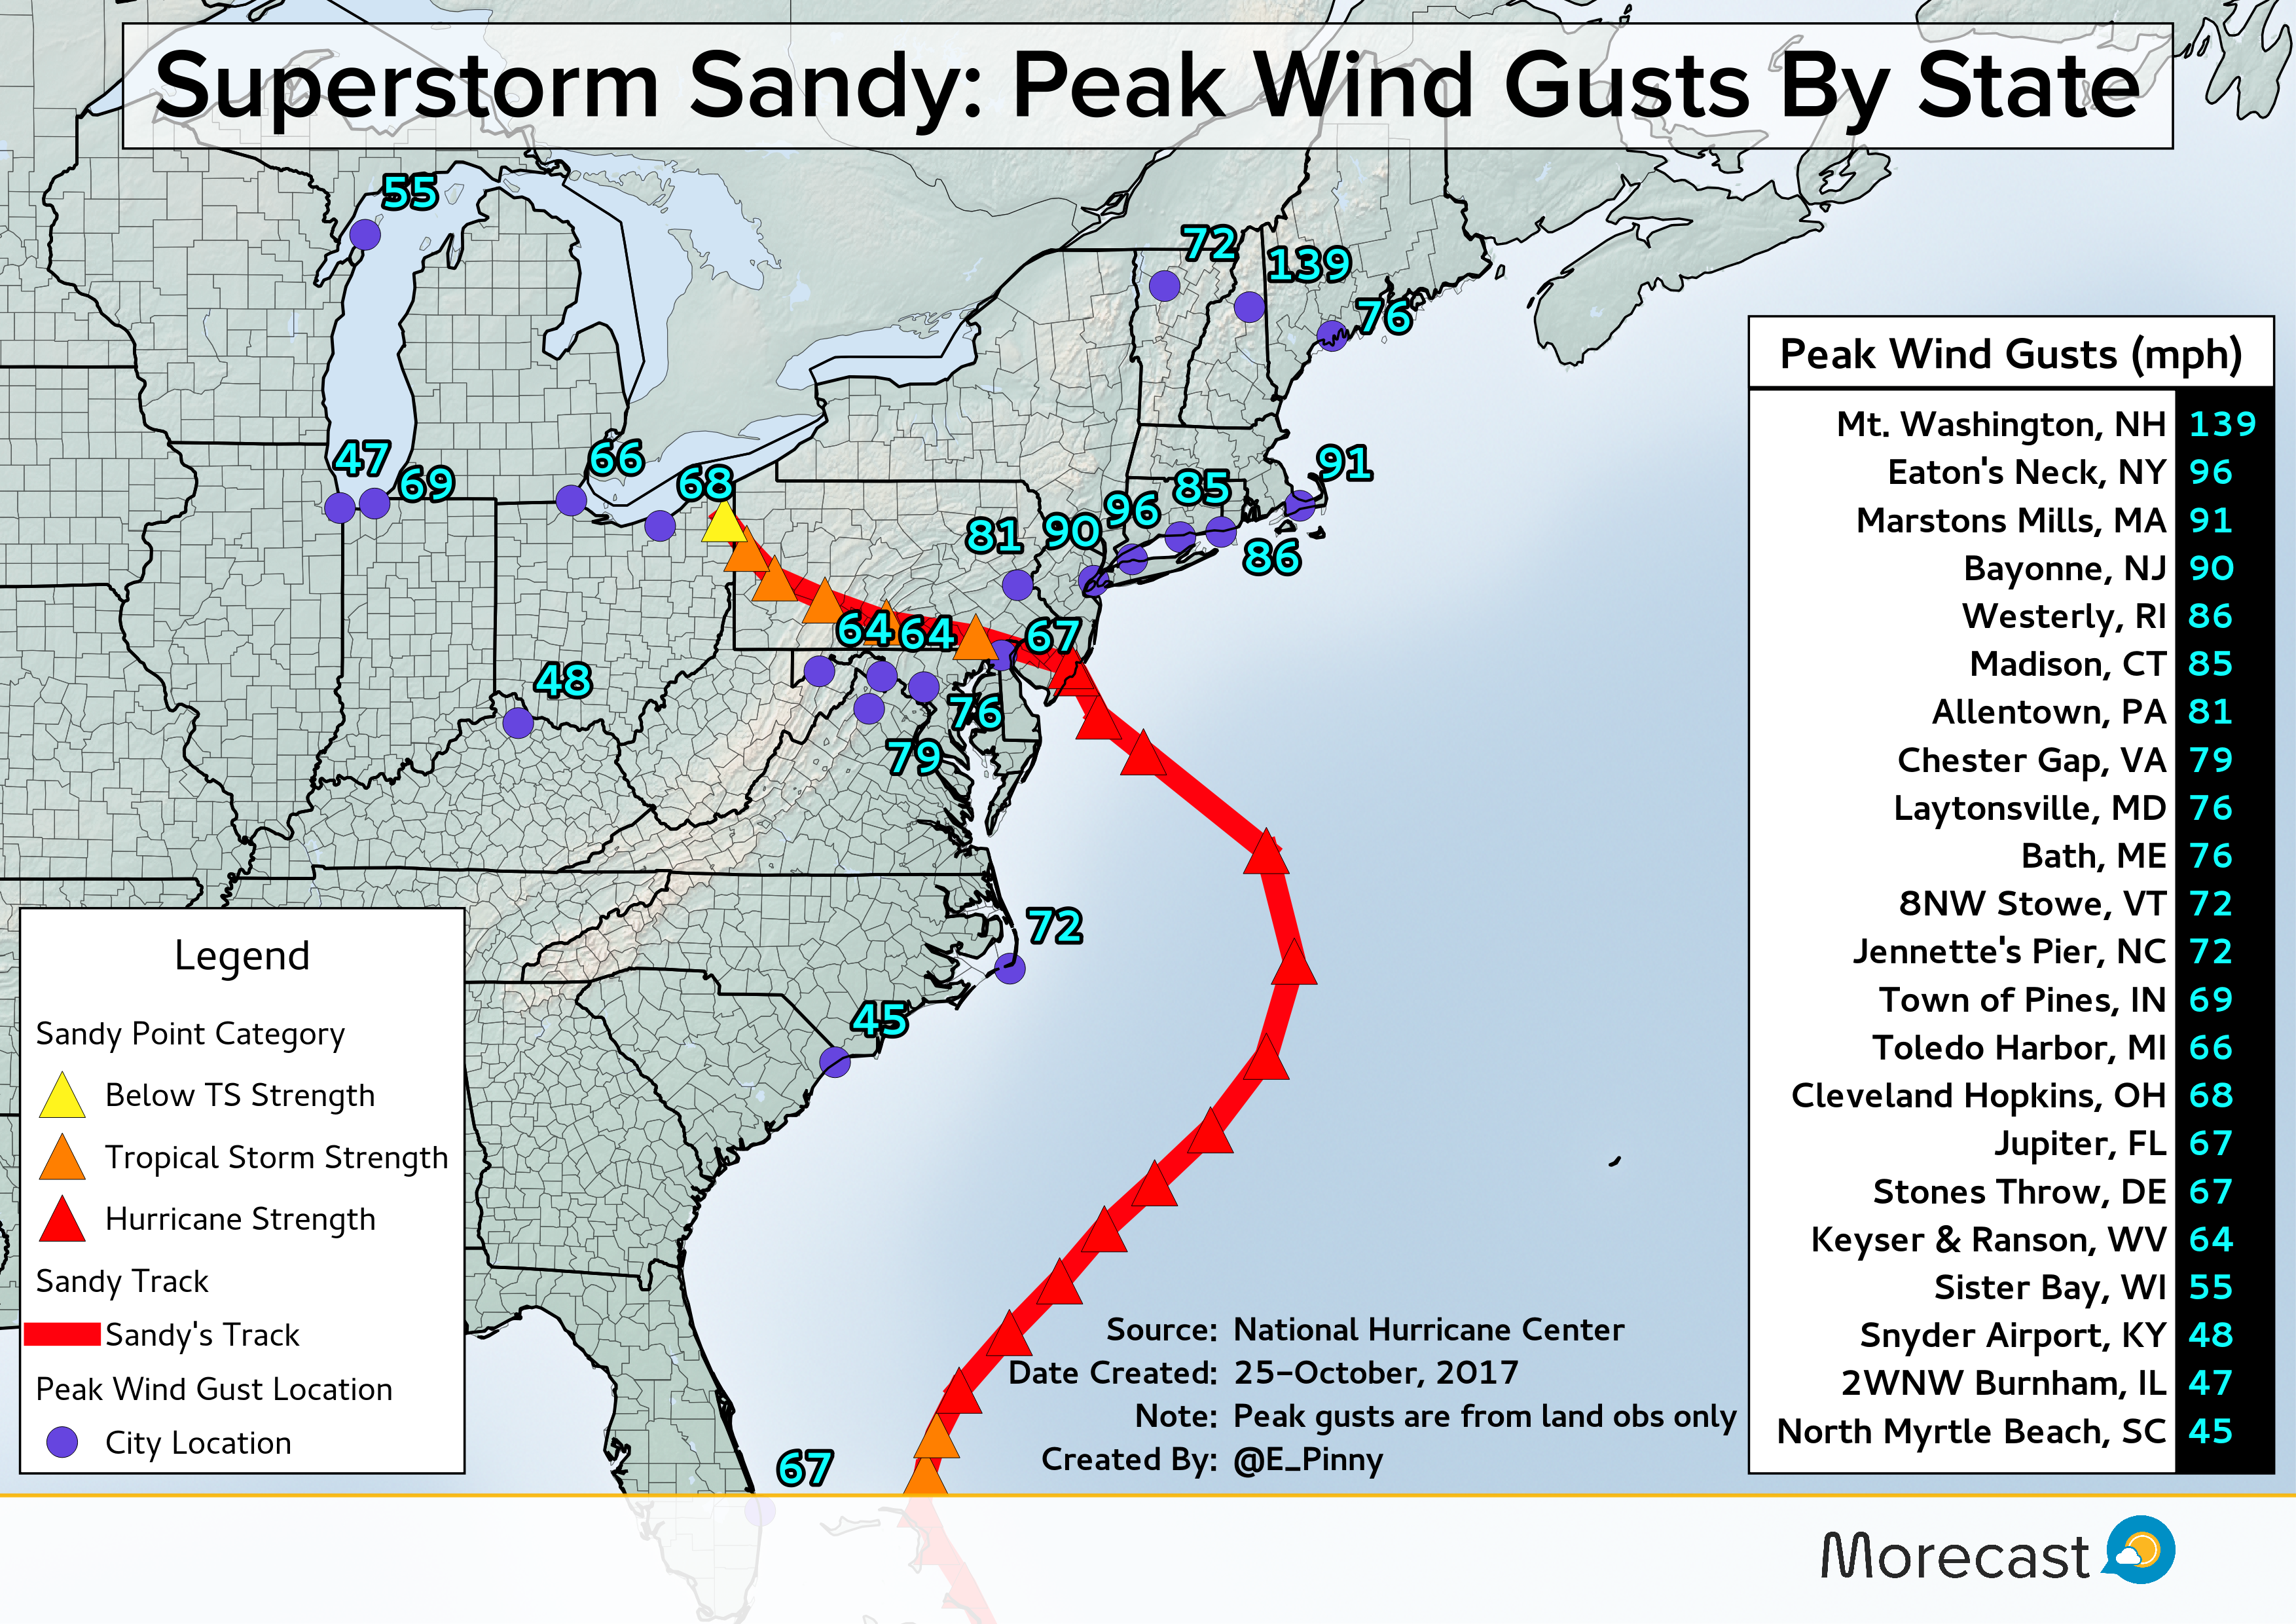
Winds

The most far-reaching impact from Sandy was the storm’s wind field. Before Sandy made landfall in New Jersey, tropical storm force winds reached a diameter of more than 1,000 miles. That is approximately the distance from Washington DC to Jacksonville, FL.

Additionally after Sandy made landfall, tropical storm force wind gusts were observed as far away as Wisconsin and Illinois!

Sandy’s winds were blamed for about 160,000 power outages in Florida, and several million outages farther north across the Mid-Atlantic states.
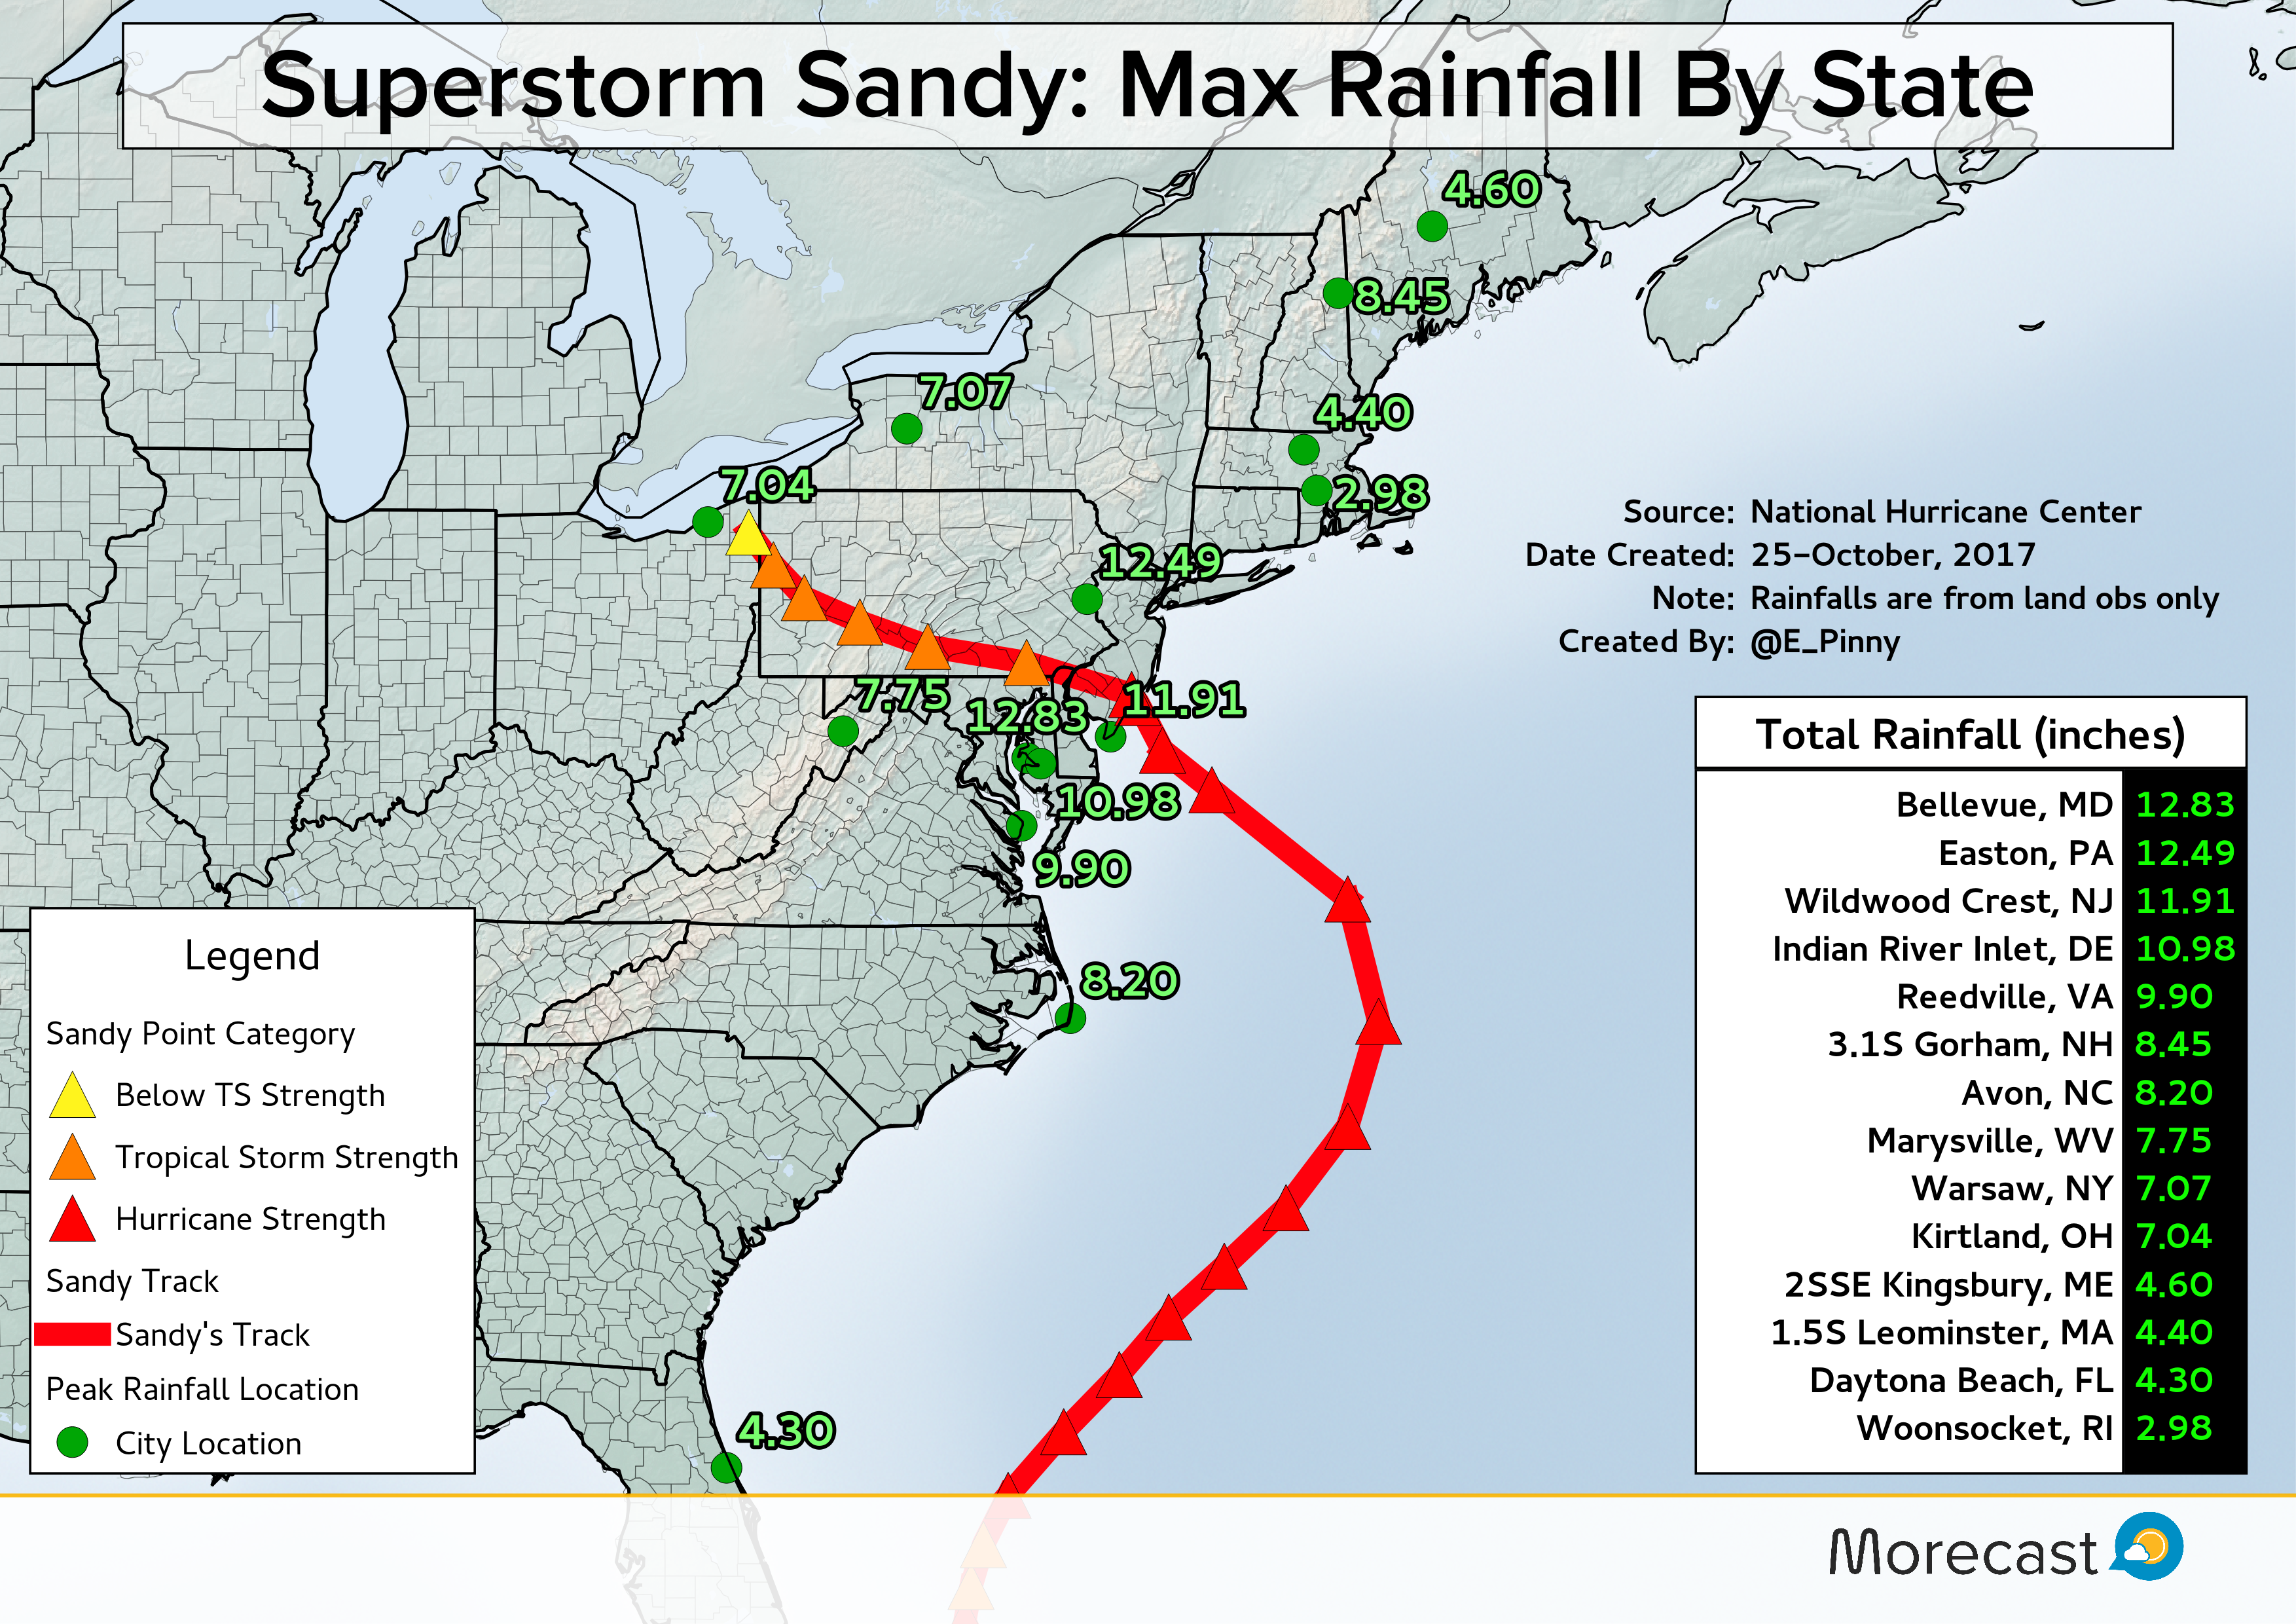
Rain

Once Sandy emerged from eastern Cuba, heavy rain pushed northward through the Bahamas as well as eastern Florida. As the storm underwent a transition from a tropical to non tropical system, the storm grew in size which helped push rain bands inland across the Southeast coast.

As is typical with systems of tropical origins that reach the mid latitudes, the heaviest rain was along and to the left of the storm track. Since Sandy took an unusual left-hand turn into New Jersey, this placed most of the heaviest rainfalls along and to the south of Sandy’s track. The exception was across interior New England where Atlantic moisture was rung out across the higher terrain of Maine, New Hampshire, and Vermont.

The combination of strong winds and flooding from heavy rain caused more than $30 million in damages across Virginia, Maryland, Delaware, and Pennsylvania.
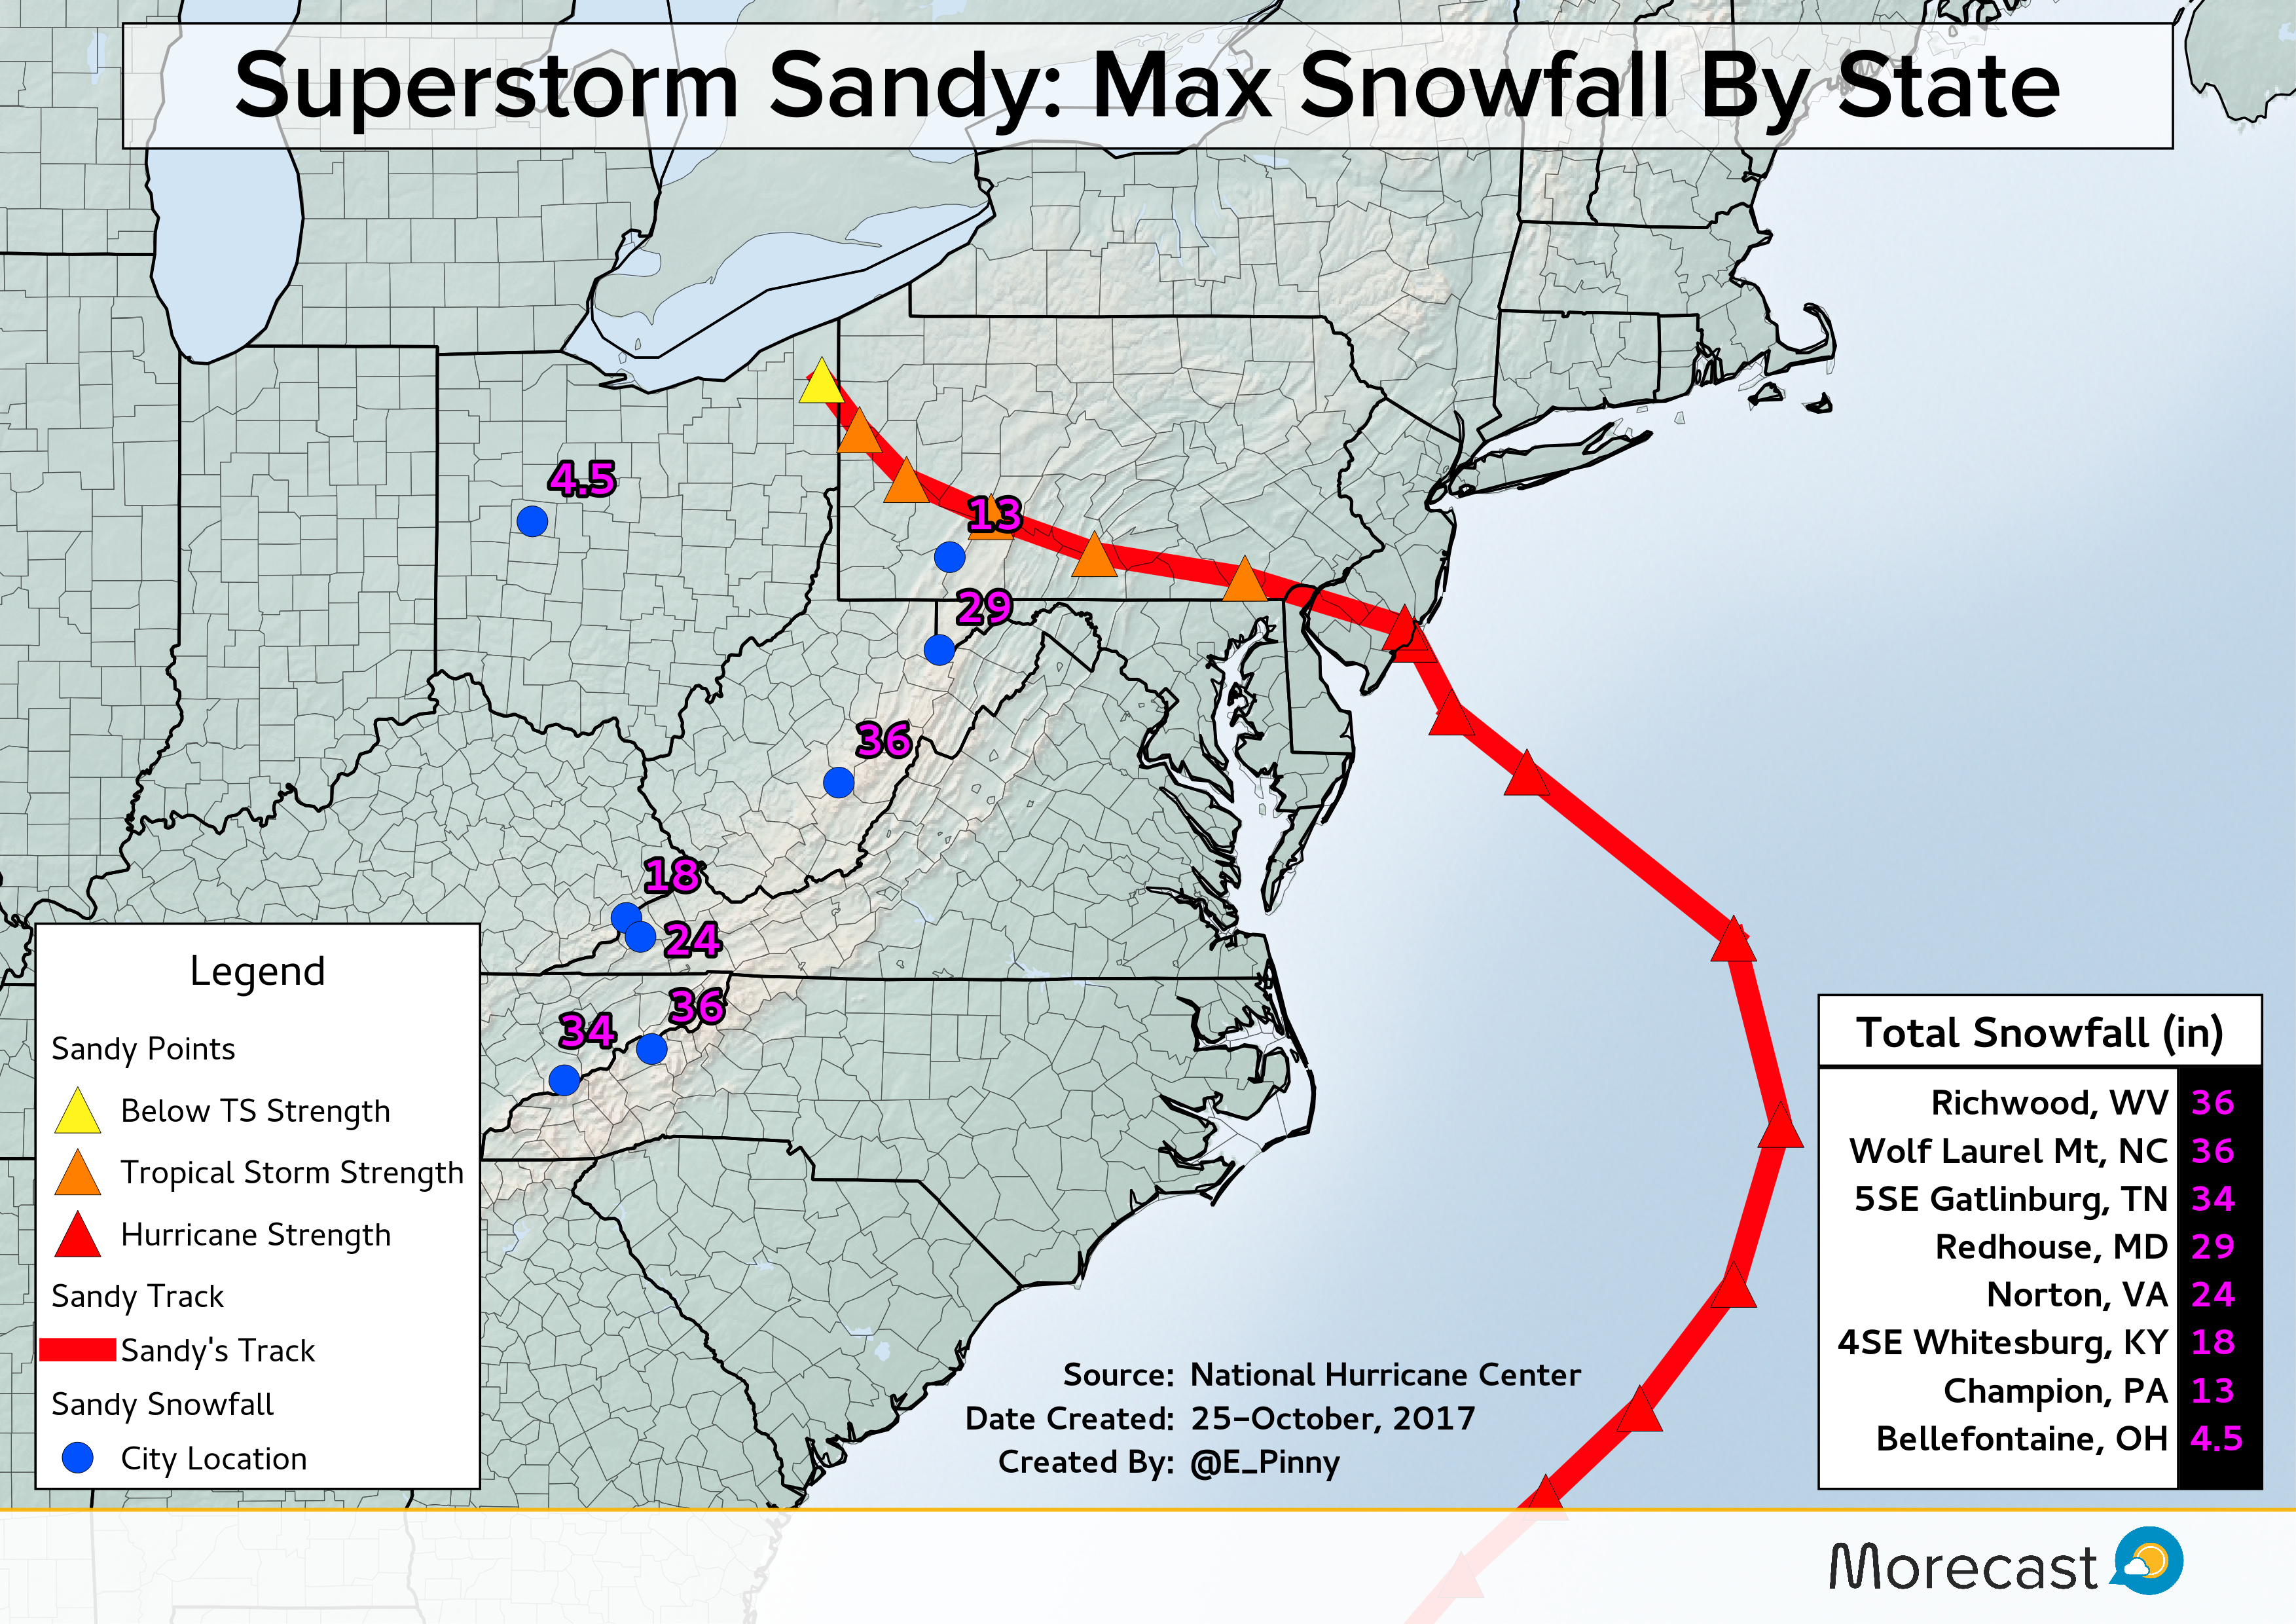
Snow

The icing on the cake for Sandy’s status as a Superstorm was the injection of arctic air from a polar disturbance, which aided in pulling the storm towards the US coast. As precipitation spread westward across the Mid-Atlantic from the coast plain, it fell into an increasingly cold environment changing the rain over to snow across the Appalachians.

One to three feet of snow pasted much of the higher terrain above 2,500 feet from the southern Appalachians northward to southwestern Pennsylvania. The weight of the snow caused a number of structures to collapse as well as thousands to lose power.