Hurricane Lane to Brush Hawaiian Islands Later This Week!
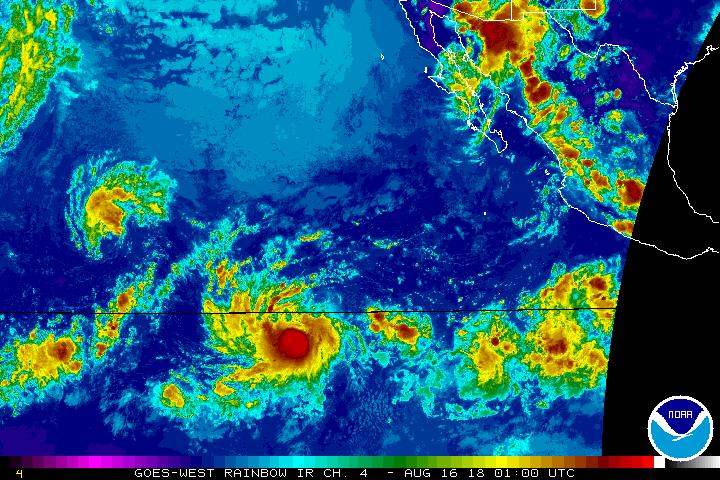
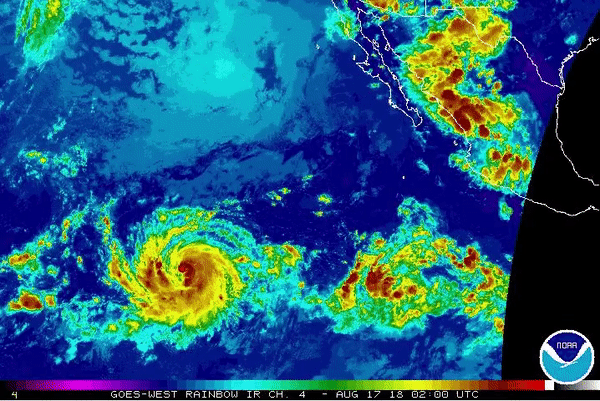
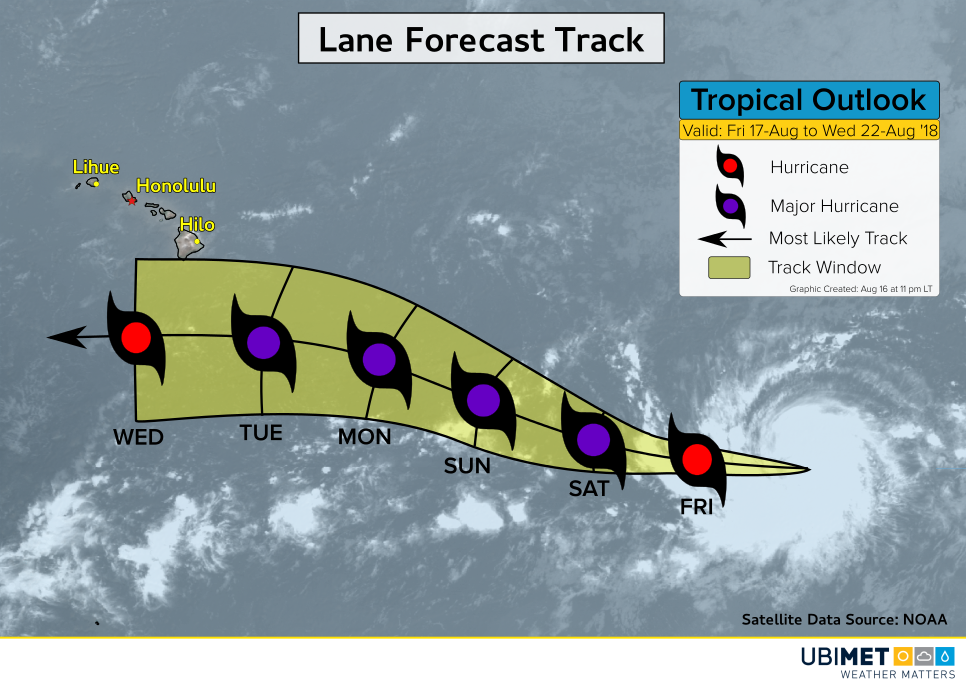
Major Hurricane Lane is moving steadily west across the open Pacific. The category four cyclone is expected to turn northwest in the next few days and move very close to the Hawaiian Islands late this week. Even if the islands escape a direct landfall, expect heavy rains, winds, and waves to slam particularly the south coasts.
Lane is moving south of a large ridge over the central Pacific. This ridge will shift a bit further east this week, allowing Lane to turn northwest. By the end of the week, Lane will be just south of the Hawaiian Islands. Some models actually bring the storm through the islands near Honolulu. Others keep it to the southwest, turning it further west by the weekend. Much uncertainty exists about the future track of Lane and interests in Hawaii should pay very close attention.
The environment is favorable for Lane to maintain intensity through the next few days. As the storm turns northwest, sea surface temperatures will decrease as upper level wind shear increases. This combination should cause Lane to weaken fairly quickly late in the week. However, Lane could still threaten the Hawaiian Islands with flooding rain, gusty winds, and high surf. These hazards will be more likely on the south sides of the islands.