According to data from the National Centers for Environmental Information, 2016 is the third warmest and 72nd wettest year on record through summer in the contiguous United States. Will the fall months of September, October, and November mimic the temperature and precipitation trends so far this year? Find out below as Mr. MORECAST breaks down weather pattern trends for fall 2016.
Fall Climatology
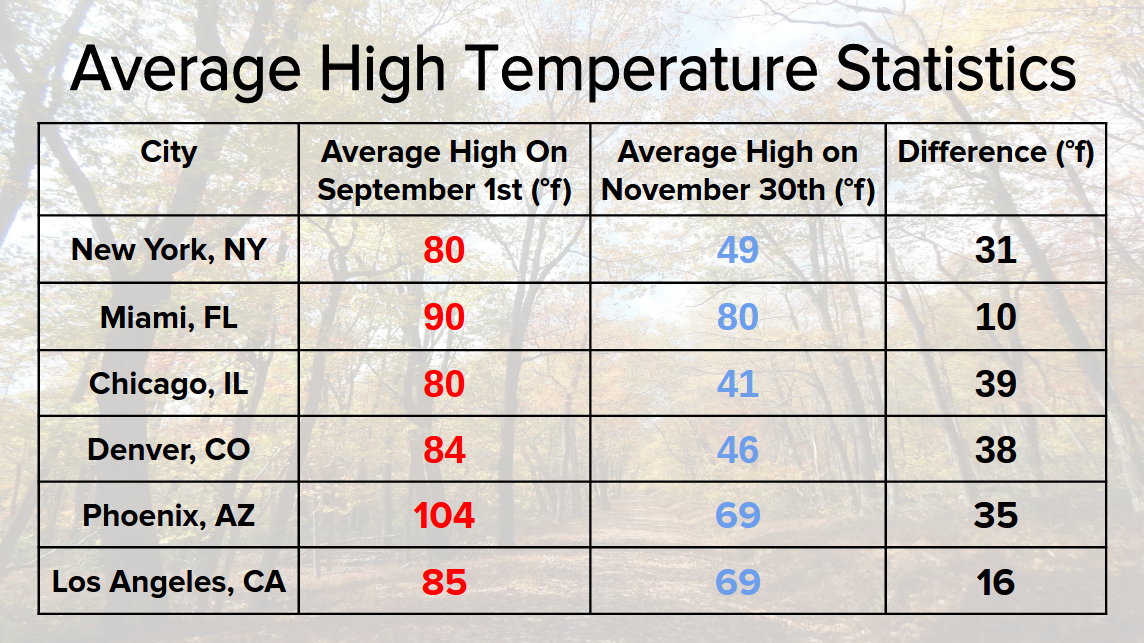
Before looking at what the weather might be like this fall, it is important to understand what is considered normal for the fall. Below is a chart that shows the average high temperature in major cities at the start September and at the end of November.
Next is an animation that details the average amount of precipitation (both rain and snow) that falls during the months of September, October, and November.
A few notable trends in fall climatology are listed below:
- Temperatures drop 30-40°F across most locations away from the Southeast and Southwest coasts
- The Pacific Northwest becomes increasingly wet
- The Northern Plains and Florida turn noticeably drier
The Importance of Sea-Surface Temperatures (SST’s)
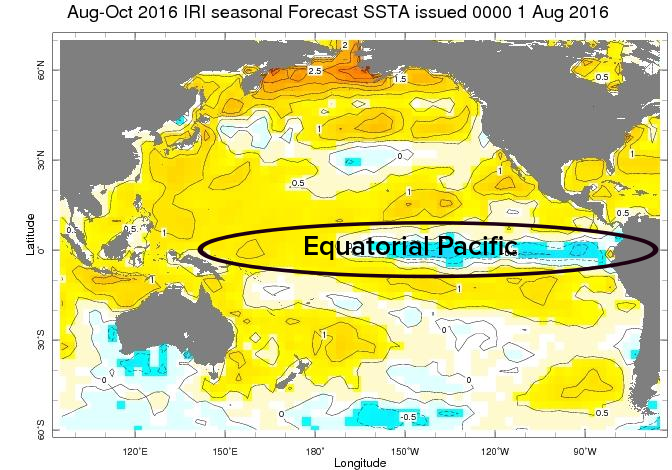
Oceans cover about 71% of Earth’s surface and are a significant driver of weather patterns across the world. Therefore, one of the most important considerations when looking ahead to monthly weather pattern trends in the United States is knowing the condition of sea surface temperatures across the Pacific and western Atlantic Oceans. The picture below shows global SST anomalies for the last week in August.
Of particular importance is the El Nino Southern Oscillation, or ENSO. ENSO is the state of sea surface temperatures (SST) around the equatorial Pacific Ocean. Warmer than average sea surface temperatures lead to an ENSO phase of El Nino. Conversely, colder than average sea surface temperatures lead to the ENSO phase of La Nina.
Weak La Nina Expected For Fall 2016
This fall, most indications are for water temperature near the central equatorial Pacific to average about 0.5°C cooler than normal. The slightly cooler than average SST’s would be at the minimum threshold for a weak La Nina phase.
Based on past weak La Nina events dating back to the 1950s, warmer than average fall temperatures were found across the Plains and Rockies. Meanwhile, slightly cooler than average temperatures existed across Florida and the Great Lakes.
Precipitation-wise, much of the Plains and East Coast were near to slightly below average during the fall months in a weak La Nina state. Meanwhile, the Great Lakes and Midwest were near to slightly above average. The Western U.S. was near average precipitation during weak La Nina phases.
The 2016 Fall forecast
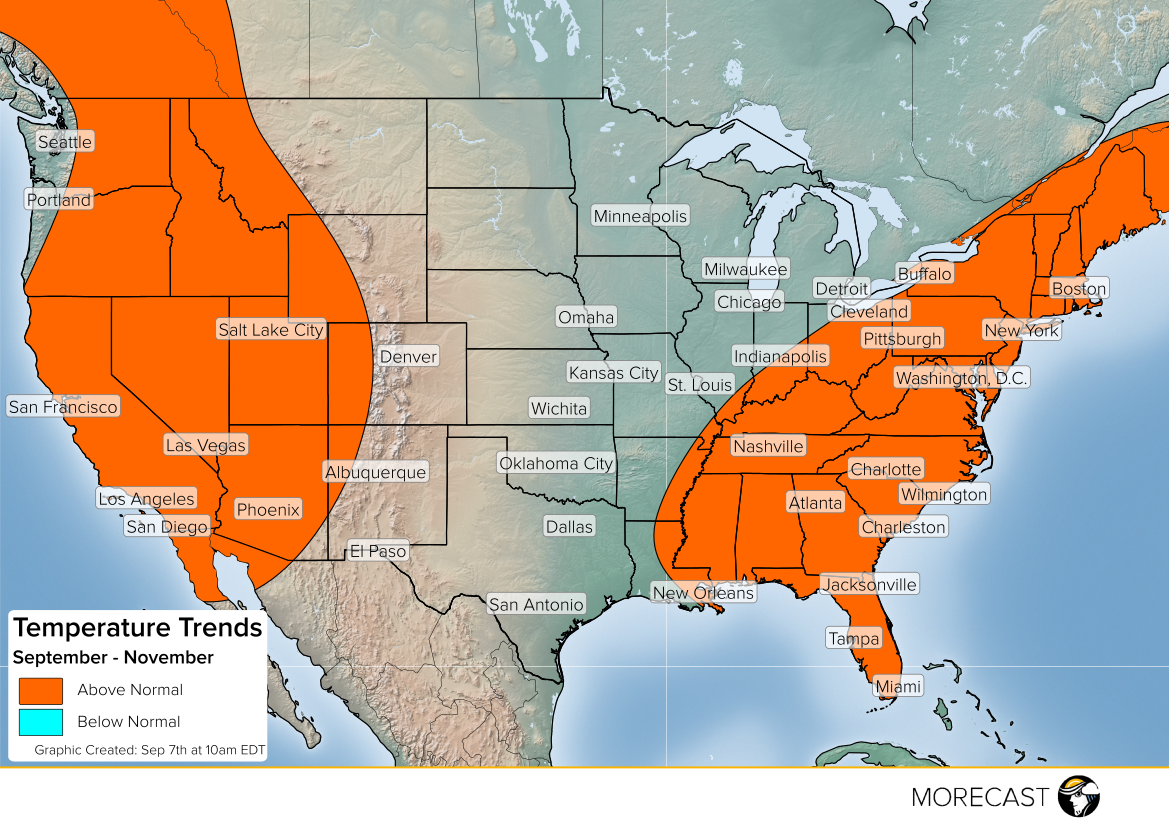
The temperature forecast for the fall season is below:
The precipitation forecast for the fall season is below:
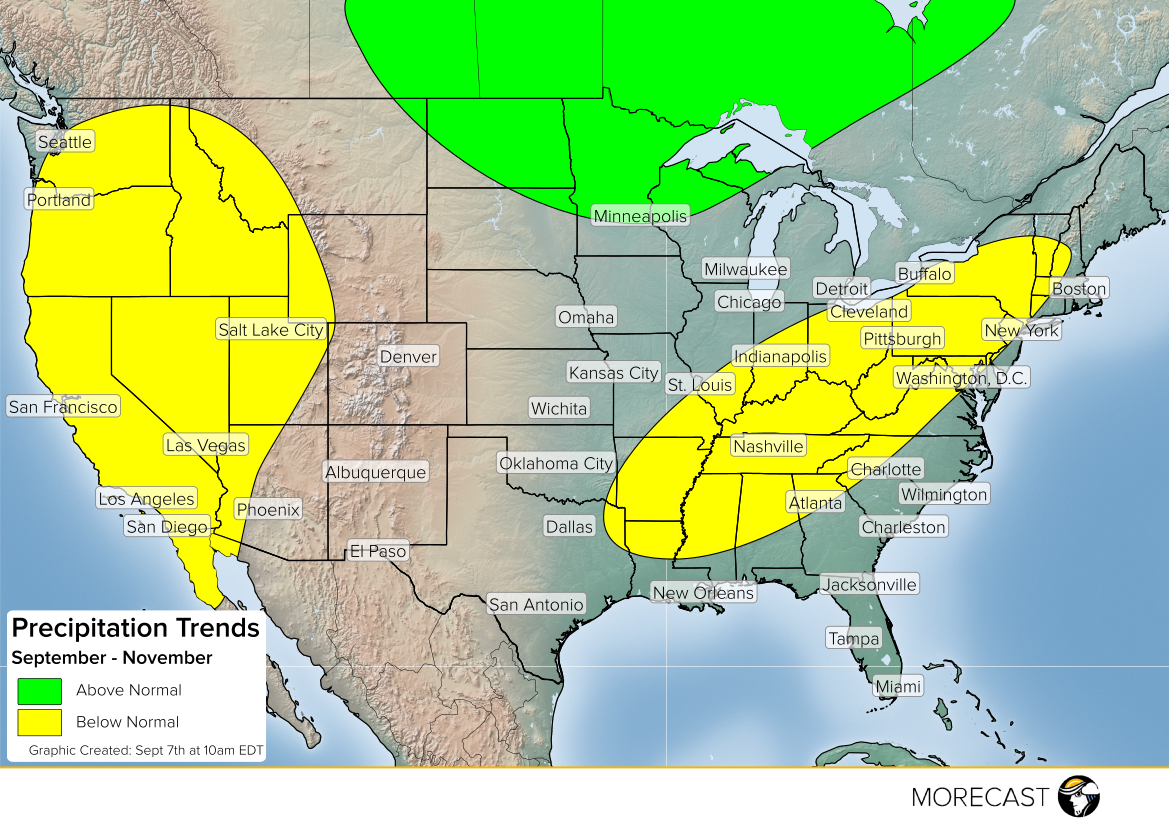
Forecast Highlights:
Eastern U.S.
- Above average temperatures are likely from the Northeast down to Florida.
- The Mississippi Valley, Ohio Valley, and the interior Northeast look to be drier than average.
Central U.S.
- Near normal temperatures are expected from the northern Plains southward through the Midwest and Texas.
- Above normal precipitation is expected from the northern Plains and upper Midwest.
- Drier than average weather is looking to shape up across the Mid South.
Western U.S.
- Above average temperatures are expected across the interior Pacific Northwest through most of the Intermountain West, the Desert Southwest, and California.
- Drier than normal weather will persist across most of the Intermountain West and California.
Note that this is more of a trend of conditions expected for the fall season. Individual weather events, such as a hurricane, could lead to localized extremes in temperature and precipitation that may not match the overall trend. But it does offer a glimpse to what Mother Nature has in store for the months ahead.